We suppose it’s a bit early to call it just yet, but we definitely have a solid contender for Father of the Year. [DIY_Maxwell] made a light-up hockey game for his young son that looks like fun for all ages. Whenever the puck is hit with the accompanying DIY hockey stick (or anything else), it lights up and produces different sounds based on its acceleration.
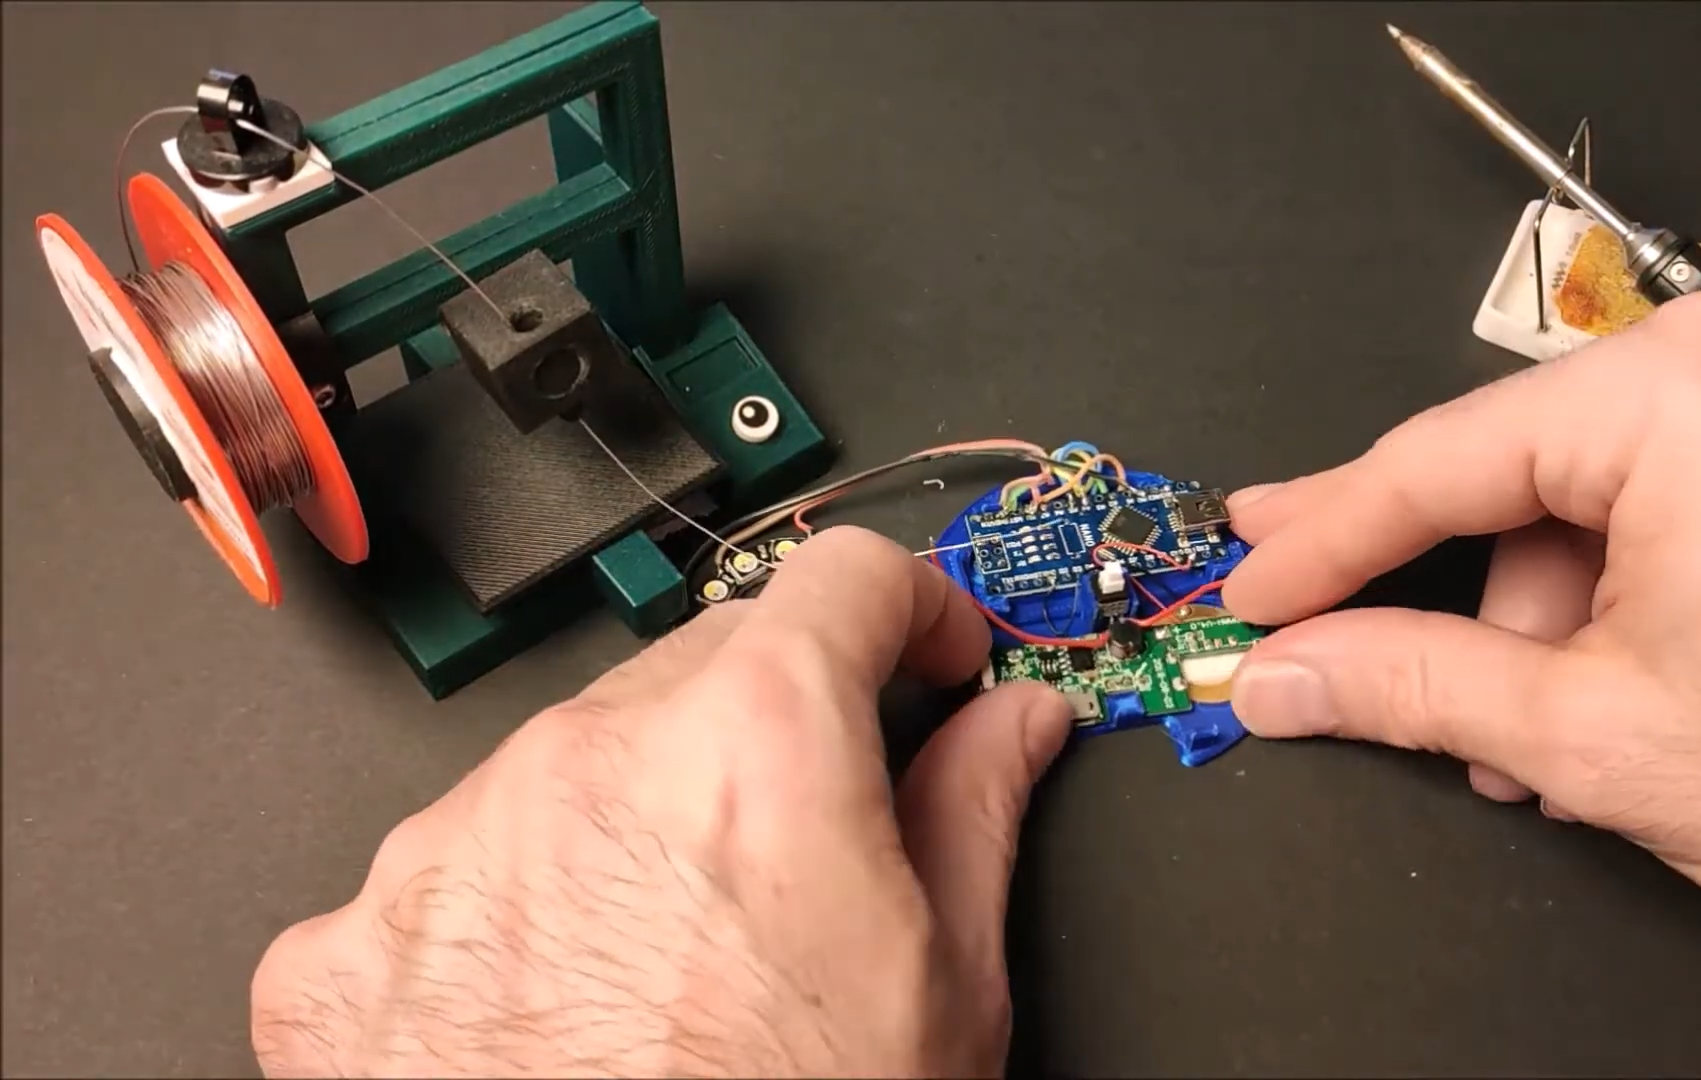
Inside the printed puck is an Arduino Nano running an MPU6050 accelerometer, a 12-NeoPixel ring, and a piezo buzzer. [DIY_Maxell] reused a power bank charging circuit to charge up the small LiPo battery.
The original circuit used a pair of coin cells, but the Arduino was randomly freezing up, probably because of the LEDs’ current draw. Be sure to check out the video after the break, which begins with a little stop motion and features a solder stand in the shape of a 3D printer.
Facebook just announced their plans for the Oculus Quest 2 VR headset. You probably won’t be surprised, but they want more of your user data, and more control over how you use the hardware. To use the device at all, you’ll need a verified Facebook account. Worse, they’re restricting access to the wide world of community-developed applications by requiring a developer account to be able to “sideload” non-Facebook software onto the device. Guess who decides who gets to be a developer. Hint: it’s not the people developing software.
Our article suggests that this will be the beginning of a race to jailbreak the headset on the community’s part, and to get ahead of the hackers on Facebook’s. Like every new release of iOS gets a jailbreak within a week or two, and then Apple patches it up as fast as they can, are we going to see a continual game of hacker cat-and-mouse with Facebook?
I don’t care. And that’s not because I don’t care about open hardware or indie VR developers. Quite the opposite! But like that romance you used to have with the girl who was absolutely no good for you, the toxic relationship with a company that will not let you run other people’s games on their hardware is one that you’re better off without. Sure, you can try to fix it, or hack it. You can tell yourself that maybe Facebook will come around if you just give them one more chance. It’s going to hurt at first.
But in the end, there is going to be this eternal fight between the user and the company that wants to use them, and that’s just sad. I used to look forward to the odd game of cat and mouse, but nowadays the cats are just too well bankrolled to make it a fair fight. If you’re buying a Quest 2 today with the intent of hacking it, I’d suggest you spend your time with someone else. You’re signing up for a string of heartbreaks. Nip it in the bud. You deserve better. There are too many fish in the sea, right?
What are our options?
This article is part of the Hackaday.com newsletter, delivered every seven days for each of the last 200+ weeks. It also includes our favorite articles from the last seven days that you can see on the web version of the newsletter.
Want this type of article to hit your inbox every Friday morning? You should sign up!
Facebook just announced their plans for the Oculus Quest 2 VR headset. You probably won’t be surprised, but they want more of your user data, and more control over how you use the hardware. To use the device at all, you’ll need a verified Facebook account. Worse, they’re restricting access to the wide world of community-developed applications by requiring a developer account to be able to “sideload” non-Facebook software onto the device. Guess who decides who gets to be a developer. Hint: it’s not the people developing software.
Our article suggests that this will be the beginning of a race to jailbreak the headset on the community’s part, and to get ahead of the hackers on Facebook’s. Like every new release of iOS gets a jailbreak within a week or two, and then Apple patches it up as fast as they can, are we going to see a continual game of hacker cat-and-mouse with Facebook?
I don’t care. And that’s not because I don’t care about open hardware or indie VR developers. Quite the opposite! But like that romance you used to have with the girl who was absolutely no good for you, the toxic relationship with a company that will not let you run other people’s games on their hardware is one that you’re better off without. Sure, you can try to fix it, or hack it. You can tell yourself that maybe Facebook will come around if you just give them one more chance. It’s going to hurt at first.
But in the end, there is going to be this eternal fight between the user and the company that wants to use them, and that’s just sad. I used to look forward to the odd game of cat and mouse, but nowadays the cats are just too well bankrolled to make it a fair fight. If you’re buying a Quest 2 today with the intent of hacking it, I’d suggest you spend your time with someone else. You’re signing up for a string of heartbreaks. Nip it in the bud. You deserve better. There are too many fish in the sea, right?
What are our options?
This article is part of the Hackaday.com newsletter, delivered every seven days for each of the last 200+ weeks. It also includes our favorite articles from the last seven days that you can see on the web version of the newsletter.
Want this type of article to hit your inbox every Friday morning? You should sign up!
Often, when we think of getting a computer to complete a task, we contemplate creating complex algorithms that take in the relevant inputs and produce the desired behaviour. For some tasks, like navigating a car down a road, the sheer multitude of input data and its relationship to the desired output is so complex that it becomes near-impossible to code a solution. In these cases, it can make more sense to create a neural network and train the computer to do the job, as one would a human. On a more basic level, [Gigante] did just that, teaching a neural network to play a basic driving game with a genetic algorithm.
The game consists of a basic top-down 2D driving game. The AI is given the distance to the edge of the track along five lines at different angles projected from the front of the vehicle. The AI also knows its speed and direction. Given these 7 numbers, it calculates the outputs for steering, braking and acceleration to drive the car.
To train the AI, [Gigante] started with 650 AIs, and picked the best performer, which just barely managed to navigate the first two corners. Marking this AI as the parent of the next generation, the AIs were iterated with random mutations. Each generation showed some improvement, with [Gigante] picking the best performers each time to parent the next generation. Within just four iterations, some of the cars are able to complete a full lap. With enough training, the cars are able to complete the course at great speed without hitting the walls at all.
It’s a great example of machine learning and the use of genetic algorithms to improve fitness over time. [Gigante] points out that there’s no need for a human in the loop either, if the software is coded to self-measure the fitness of each generation. We’ve seen similar techniques used to play Mario, too. Video after the break.
An international team at Penn State led by [Larry Cheng] made a breakthrough in printing sensors directly on skin without heat. The breakthrough here is the development of a room-temperature sintering technique. Typical sintering of copper happens at 300 C, and can be further lowered to 100 C by adding nanoparticles. But even 100 C is too hot, since skin starts to burn at around 40 C.
You can obtain their journal article if you want the details, but basically their technique combines the ingredients in peelable face masks and eggshells. With this printed circuit is applied to the skin, the sintering process only requires a hair dryer on the cool setting, and results can bend and fold without breaking the connections. A hot shower will remove the circuit without damaging the circuit or your skin. [Larry] says the circuits can be recycled.
They are using these sensors to monitor temperature, humidity, blood oxygen levels, and heart performance indicators. They’ve even linked these various on-body sensors with a WiFi network for ease of monitoring. After reading this report, we’re left wondering, if the sensor is directly on your skin, can it be really called wearable?
We’ve written about printable inks before, but for printed circuit board applications. We can’t help but wonder if this technology would help solve some problems inherent in that technology, as well. Thanks to [Qes] for the tip.
[Marquis de Geek] has a profound love of old systems. Tired of writing new emulators from scratch for each project, his newest project EMF generates the emulator for him. An XML document describes the layout of the memory, CPU description, and screen handler. The output is currently a single-page Javascript emulator application with an assembly and a dissembler. However, but that backend can easily be swapped to another language such as Rust or C++.
Since EMF is a framework that provides a common way to describe the emulated machine, you get a common emulator user interface for free. There’s a lot of flexibility offered here as well. Opcodes can be implemented as a large switch statement or individual functions, depending on the target language’s performance. Self-modifying code can be detected and handled separately. Custom features or hardware can be injected easily by writing a module in the target language.
While the source code for the EMF hasn’t been released yet, several of the machines that [Marquis de Geek] has built with EMF are open-source on GitHub. So far the list includes Dragon32, Sinclair ZX80, Sinclair ZX81, Sinclair ZX Spectrum, Elliott 903, Chip8, Cosmac VIP, and the MegaProcessor. Each has a live emulator that runs in your browser.
While [Marquis de Geek] hopes to release a binary version of the EMF soon, we’re very much looking forward to the EMF source coming out once the code has been cleaned up. We love the trend towards creating easier and more accessible emulators, such as this Twitter bot that runs Atari programs.
Companies spend thousands developing a project for the market, hoping their investment will return big. Investing like this happens every day and won’t shock anyone. What may surprise you is someone who spends more than a decade and thousands of their own dollars to make an open-source version of a highly-marketable product. In this case, we’re talking about genetically modified yeast that produces spider silk. If that sounds like a lead-in to some Spiderman jokes and sci-fi references, you are correct on both accounts. [Justin Atkin] had some geneticist work under his belt when he started, so he planned to follow familiar procedures like extracting black widow DNA, isolating and copying the silk genes, and pasting them into a yeast strain. Easy peasy, right? Naturally, good science doesn’t happen overnight.
There are a few contenders for the strongest spider silk among which the golden silk orb-weaver gets the most attention, but the black widow’s webbing is nearly as strong, and [Justin] is happy to wear black widow inspired bling, whereas the golden orb-weaver looks like it crawled out of Starship Troopers. His first attempt to extract DNA starts with a vial of preserved nightmare fuel spider specimens because that is a thing you can just go online and buy. Sadly, they were candied in alcohol, and that obliterates DNA, so he moved to dried specimens from breeders, which also failed to produce results, and those were just the landmark hangups.
After all the setbacks and dead ends, [Justin] and his lab crew take a different path and design a plasmid-to-order. Sheesh, you can buy anything on the Internet. Labs that build these sequences aren’t like a custom T-shirt producer because you can’t just send them Gattaca.TXT and a check. The labs will refuse sequences with repetitious snippets, and spider silk is long repeating chains. [Justin] has to make his recurrent silk look unique all the way through, and so he has to tweak nature’s recipe.
Silk is not a singular thing but rather a classification of what comes from a spinneret. Spiders produce as many as ten varieties of silk, and they are a combination of monomers. Some are sticky, some are stretchy, and some are strong, but for commercially viable stuff, we are interested in dragline which is firm and not elastic. It is safe to assume this is what [Peter Parker] loads into his web slingers. The variety comes from ordering and reordering the stretchy-strong sequence to increase the variabilty, but that only goes so far. [Justin] adds a new contribution to the mix, and that comes in the form of biomineralization, which we see in things like nacre (mother of pearl), chitin, and bones. This is one of the sturdiest things mother nature put into animals, so the improved formula has a little extra strength in the mix. Another ingredient is the sequence to tell the yeast to excrete the silk, not just produce it internally. This makes harvesting the difference between milking a cow and butchering one.
When the lab’s plasmid arrives, they mix it into some pichia pastoris yeast which is normally pinkish, but the modified strain is bone white. It is a fickle strain and doesn’t want to accept the new genes, but Youtube commentators provided helpful protocols. This in itself is an achievement, as if you can get the YT comment section to provide useful data, you deserve a trophy. After the new procedures, a battery of tests shows that gene modification took hold. [Justin]’s yeast was producing silk at a respectable rate. Wow.
Now, the plan is to find ways to do something with the mass-producible silk. We love the idea of growing tough-as-nails cargo pants or black widow web-shooters. Spider senses not included.
Eight-bit computers are all the retro rage these days, with people rushing to build computers either from chips like the 6502 or the Z80, or even recreating these chips from a collection of TTL logic chips. And while we respect and covet those builds immensely, 8-bit computers aren’t the only game going on. To wit we present this lovely single-board computer sporting a 1-bit CPU.
The machine, which creator [Simon Boak] cheekily dubs “the world’s least-powerful computer,” is based on the Motorola MC14500B, a chip from the 1970s that was aimed at the industrial controls market. There, the chip’s limited instruction set and narrow bus width were not as limiting as they would be in a general-purpose computer. In fact, since the chip requires an external program counter, it offers a great degree of design flexibility. [Simon] chose a 4-bit address space, but with a little wizardry he was able to get eight bits of input in the form of DIP switches and eight bits of output LEDs. It’s not good for much past making lights blink, but it does that with nary an Arduino in view — although it does sport a couple of 555s.
[Simon]’s goal for the build was simply to build cool from an unusual chip, and we think he succeeded. In fact, we can’t recall seeing a neater perfboard build — it’s almost to the level of circuit sculpture. We especially like the hybrid solder and wirewrap construction. We’ve seen builds based on this chip before, but never one so neat and attractive.
What’s the use of waiting around for something to break in order to hack into something else? As long as it’s just sitting around not being used, who cares? [OmniSaiRen] had a Behringer MIDI controller just taking up space. Instead of selling it, they decided to build it into something they would definitely use — a multi-volume controller with mute keys and other useful macros.
After gutting the case, [OmniSaiRen] gave it a couple coats of glossy white paint that looks really nice with the black keycaps and knobs. The plan was to use the original encoders, but [OmniSaiRen] replaced them with potentiometers when they couldn’t get the encoders working with the Arduino Nano. We are sad to report that Cherry Blues only made it to the build because they have all black housings and were also lying around taking up space, but maybe [OmniSaiRen] will grow to love them.
As a debugger, GDB is a veritable Swiss Army knife. And just like exploring all of the non-obvious uses of a those knives, your initial response to the scope of GDB’s feature set is likely to be one of bewilderment, subsequent confusion, and occasional laughter. This is an understandable reaction in the case of the Swiss Army knife as one is unlikely to be in the midst of an army campaign or trapped in the wilderness. Similarly, it takes a tricky debugging session to really learn to appreciate GDB’s feature set.
If you have already used GDB to debug some code, it was likely wrapped in the comfort blanket of an IDE. This is of course one way to use GDB, but limits the available features to what the IDE exposes. Fortunately, the command line interface (CLI) of GDB has no such limitations. Learning the CLI GDB commands also has the advantage that one can perform that critical remote debug session even in the field via an SSH session over the 9600 baud satellite modem inside your Swiss Army knife, Cyber Edition.
Have I carried this analogy too far? Probably. But learning the full potential of GDB is well worth your time so today, let’s dive in to sharpen our digital toolsets.
Godmode for Running Code
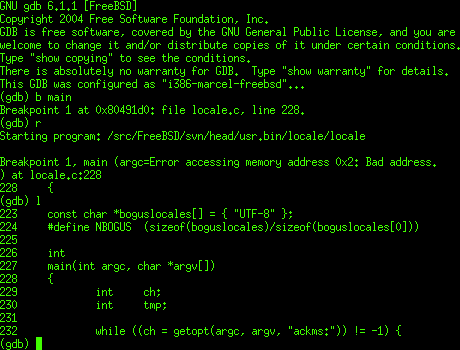
Example GDB session.
The concept behind a debugger is fairly uncomplicated: all too often something is preventing code which you have written from working, or you want to take a closer look at certain states within the application as it is executing. A simple way to do this is by printing out the values of variables to a terminal or serial port, but the much more powerful way is to use a debugger like GDB to interactively work with the code as it executes.
This means pausing the execution, stepping forward and backward through individual lines of code, inspecting stack frames and parts of memory, modifying the contents of memory and specific variables, and so on. Along with the setting of breakpoints and the watching of variables, virtually any part of the application’s execution can be monitored and influenced. This includes when things go south and the execution terminates with some fault condition, allowing a stack trace to be recalled.
While GDB can be used with any application’s binary, it’s infinitely more useful when the debug symbols are also provided to the debugger. These debug symbols are text strings including source code, as well as other information. They are included in the binary by the compiler when instructed to do so. For GCC-based compilers and LLVM this is usually done using the -g flag.
Local Hero
Running through a local debug session is a good way to become acquainted with how to use GDB’s command line interface. Be sure to have a handy command reference within easy reach at any time when using GDB. Doing so will make it easy to become familiar with the more involved commands.
The essential ones to know are break (b), for setting a break point, info for obtaining information locals, threads, etc. Further backtrace (bt) and continue (c), next (n) and step (s) for printing out a backtrace, continuing execution and moving through the code in increments, respectively. After loading the executable with GDB, the program is started with run (r), which can be supplied with any command line arguments to the executable.
Let’s write a very simple program we can use for debugging practice:
/* hello.c - Hello World */

#include<stdio.h>

int main(void) {
        char hello[] = "Hello World";
        printf("%s\n", hello);
        return 0;
}
We’ll use the -g3 flag when compiling to include debug symbols. Now let’s walk through this C-based Hello World example:
gcc -o hello -g3 hello.c
gdb ./hello

[..]
(gdb) b main
Breakpoint 1 at 0x1169: file hello.c, line 5.
(gdb) run
Starting program: /home/hackaday/hello
Breakpoint 1, main() at hello.c:5
5 int main(void) {
(gdb) n
6 char hello[] = "Hello World";
(gdb) n
7 printf("%s\n", hello);
(gdb)
We first set a break point at the main()function, then run to start the program. After the breakpoint, with each execution of next (or just hitting enter on an empty input to repeat the previous command), we’ll proceed to the next line of the application, without stepping into function calls. That’s what step is for. If we use printf() in the code, for example, using step would cause us to examine every line of that function and its implementation as well. Whether this is desirable depends on one’s needs.
Finally, we can examine variables and memory using print (p) for printing variables and x to print bytes at a memory address. E.g.:
(gdb) print hello
$1 = "Hello World"
Most of the commands are quite straight-forward, and safe. Barring the use of GDB’s set command, using which one can not only change GDB’s settings, but also edit memory contents. Use this one with caution.
Jacking Into the Remote
Running a remote GDB session is roughly the same as a local session, with the obvious complication of having to establish the session on a remote system. Said remote system can be anything from a server, desktop or other system running a full-blown OS, down to a microcontroller (MCU) running straight on the bare metal.
The main requirement for GDB to establish a debugging session on a remote system, is for there to be a GDB server (gdbserver) instance which the GDB tool can connect to. This GDB server then acts as a bridge between GDB and the active debug session. This connection can be established via TCP or a serial line. This makes it a highly portable approach that works both for remote servers or desktop systems, as well as industrial boards with an RS-232C link.
Even more interesting is to use the GDB server approach to create a bridge to the in-circuit debugger functionality provided by microcontroller platforms such as ST’s STM32 Cortex-M-based systems. This same approach will work with few modifications for Microchip’s ARM-based SAM and AVR platforms.
OpenOCD as GDB server
Anyone who has done MCU development is likely familiar with OpenOCD. This tool is invaluable in the programming of a wide variety of MCUs, but also comes with a built-in GDB server. As an example, imagine wanting to establish a GDB session on an STM32 MCU, on a common development board like the STM32F4-Discovery one.
The first step is to start OpenOCD’s GDB server:
openocd -f board/stm32f4discovery.cfg
Next, we can connect to this server via the loopback interface, while also providing GDB (from the arm-none-eabi toolchain) with the path to the ELF binary containing the firmware:
GDB will now connect to the GDB server, with OpenOCD using the STM32F4-Discovery board’s in-circuit debugger feature of the onboard ST-Link/V2 interface. All protocol translation is now done by OpenOCD, enabling all the usual GDB features, even though the code we are debugging runs on the MCU on the development board.
As the MCU will already have booted the firmware we wish to debug, we will still have to perform one more step, which is to reset the MCU to get a GDB session we can use:
(gdb) mon reset halt
The MCU will now have been reset and in a halted state until we do something. We will now add a new temporary breakpoint and continue:
(gdb) tbreak main
(gdb) c
After continuing execution, this temporary breakpoint puts us right at the beginning of our main function, from which we can set up breakpoints and more as needed. For example, we can check out the value of a specific register of the GPIOA peripheral on this STM32F4-based board. Say we want to see whether the input and output states were set properly in the GPIO_MODER register:
(gdb) x/4tb 0x40020000
$1 = 0100 0000 0000 0000
The special syntax of the x command prints a single 32-bit address, as blocks of single bytes. The GPIOA peripheral location is found in the STM32F407 datasheet, with the Reference Manual (RM) listing the offsets for specific registers within the memory-mapped IO for that peripheral type. In this case the MODER register is at offset 0x00, with GPIOA at address 0x40020000. The byte order is printed left to right, meaning that the first byte is on the left side.
In this case we can see that MODER1 (for pin 1) is set to ’01’, meaning general-purpose output mode.
Time to Quit Guessing
Many are the times when I found myself or others get stuck pouring over lines of code, speculating which one of those lines might be the cause of the weird symptoms. Suffice it to say that doing so is neither fun nor productive. Along with tools like Valgrind, debuggers like GDB are perfect for getting answers to questions, even questions you didn’t know you wanted to ask. It’s especially useful with something like embedded development, where the immediate feedback from newly flashed firmware might be… absent or not quite as expected.
It pays to establish a strict routine of testing for isolating test cases, and to hit the problematic firmware in-situ with a targeted testing plan, using tools like GDB. Create a checklist of which items to check first when something doesn’t work, then work your way up from there.
As non-deterministic as debugging sometimes may seem — and with Heisenbugs certainly endeavoring to make it appear that way — in the end there’s a good, solid reason for every issue. You just need to find out what bit to look at in which manner. Becoming comfortable with a powerful tool like GDB is definitely a major asset there.
As a debugger, GDB is a veritable Swiss Army knife. And just like exploring all of the non-obvious uses of a those knives, your initial response to the scope of GDB’s feature set is likely to be one of bewilderment, subsequent confusion, and occasional laughter. This is an understandable reaction in the case of the Swiss Army knife as one is unlikely to be in the midst of an army campaign or trapped in the wilderness. Similarly, it takes a tricky debugging session to really learn to appreciate GDB’s feature set.
If you have already used GDB to debug some code, it was likely wrapped in the comfort blanket of an IDE. This is of course one way to use GDB, but limits the available features to what the IDE exposes. Fortunately, the command line interface (CLI) of GDB has no such limitations. Learning the CLI GDB commands also has the advantage that one can perform that critical remote debug session even in the field via an SSH session over the 9600 baud satellite modem inside your Swiss Army knife, Cyber Edition.
Have I carried this analogy too far? Probably. But learning the full potential of GDB is well worth your time so today, let’s dive in to sharpen our digital toolsets.
Godmode for Running Code
Example GDB session.
The concept behind a debugger is fairly uncomplicated: all too often something is preventing code which you have written from working, or you want to take a closer look at certain states within the application as it is executing. A simple way to do this is by printing out the values of variables to a terminal or serial port, but the much more powerful way is to use a debugger like GDB to interactively work with the code as it executes.
This means pausing the execution, stepping forward and backward through individual lines of code, inspecting stack frames and parts of memory, modifying the contents of memory and specific variables, and so on. Along with the setting of breakpoints and the watching of variables, virtually any part of the application’s execution can be monitored and influenced. This includes when things go south and the execution terminates with some fault condition, allowing a stack trace to be recalled.
While GDB can be used with any application’s binary, it’s infinitely more useful when the debug symbols are also provided to the debugger. These debug symbols are text strings including source code, as well as other information. They are included in the binary by the compiler when instructed to do so. For GCC-based compilers and LLVM this is usually done using the -g flag.
Local Hero
Running through a local debug session is a good way to become acquainted with how to use GDB’s command line interface. Be sure to have a handy command reference within easy reach at any time when using GDB. Doing so will make it easy to become familiar with the more involved commands.
The essential ones to know are break (b), for setting a break point, info for obtaining information locals, threads, etc. Further backtrace (bt) and continue (c), next (n) and step (s) for printing out a backtrace, continuing execution and moving through the code in increments, respectively. After loading the executable with GDB, the program is started with run (r), which can be supplied with any command line arguments to the executable.
Let’s write a very simple program we can use for debugging practice:
/* hello.c - Hello World */

#include<stdio.h>

int main(void) {
        char hello[] = "Hello World";
        printf("%s\n", hello);
        return 0;
}
We’ll use the -g3 flag when compiling to include debug symbols. Now let’s walk through this C-based Hello World example:
gcc -o hello -g3 hello.c
gdb ./hello

[..]
(gdb) b main
Breakpoint 1 at 0x1169: file hello.c, line 5.
(gdb) run
Starting program: /home/hackaday/hello
Breakpoint 1, main() at hello.c:5
5 int main(void) {
(gdb) n
6 char hello[] = "Hello World";
(gdb) n
7 printf("%s\n", hello);
(gdb)
We first set a break point at the main()function, then run to start the program. After the breakpoint, with each execution of next (or just hitting enter on an empty input to repeat the previous command), we’ll proceed to the next line of the application, without stepping into function calls. That’s what step is for. If we use printf() in the code, for example, using step would cause us to examine every line of that function and its implementation as well. Whether this is desirable depends on one’s needs.
Finally, we can examine variables and memory using print (p) for printing variables and x to print bytes at a memory address. E.g.:
(gdb) print hello
$1 = "Hello World"
Most of the commands are quite straight-forward, and safe. Barring the use of GDB’s set command, using which one can not only change GDB’s settings, but also edit memory contents. Use this one with caution.
Jacking Into the Remote
Running a remote GDB session is roughly the same as a local session, with the obvious complication of having to establish the session on a remote system. Said remote system can be anything from a server, desktop or other system running a full-blown OS, down to a microcontroller (MCU) running straight on the bare metal.
The main requirement for GDB to establish a debugging session on a remote system, is for there to be a GDB server (gdbserver) instance which the GDB tool can connect to. This GDB server then acts as a bridge between GDB and the active debug session. This connection can be established via TCP or a serial line. This makes it a highly portable approach that works both for remote servers or desktop systems, as well as industrial boards with an RS-232C link.
Even more interesting is to use the GDB server approach to create a bridge to the in-circuit debugger functionality provided by microcontroller platforms such as ST’s STM32 Cortex-M-based systems. This same approach will work with few modifications for Microchip’s ARM-based SAM and AVR platforms.
OpenOCD as GDB server
Anyone who has done MCU development is likely familiar with OpenOCD. This tool is invaluable in the programming of a wide variety of MCUs, but also comes with a built-in GDB server. As an example, imagine wanting to establish a GDB session on an STM32 MCU, on a common development board like the STM32F4-Discovery one.
The first step is to start OpenOCD’s GDB server:
openocd -f board/stm32f4discovery.cfg
Next, we can connect to this server via the loopback interface, while also providing GDB (from the arm-none-eabi toolchain) with the path to the ELF binary containing the firmware:
GDB will now connect to the GDB server, with OpenOCD using the STM32F4-Discovery board’s in-circuit debugger feature of the onboard ST-Link/V2 interface. All protocol translation is now done by OpenOCD, enabling all the usual GDB features, even though the code we are debugging runs on the MCU on the development board.
As the MCU will already have booted the firmware we wish to debug, we will still have to perform one more step, which is to reset the MCU to get a GDB session we can use:
(gdb) mon reset halt
The MCU will now have been reset and in a halted state until we do something. We will now add a new temporary breakpoint and continue:
(gdb) tbreak main
(gdb) c
After continuing execution, this temporary breakpoint puts us right at the beginning of our main function, from which we can set up breakpoints and more as needed. For example, we can check out the value of a specific register of the GPIOA peripheral on this STM32F4-based board. Say we want to see whether the input and output states were set properly in the GPIO_MODER register:
(gdb) x/4tb 0x40020000
$1 = 0100 0000 0000 0000
The special syntax of the x command prints a single 32-bit address, as blocks of single bytes. The GPIOA peripheral location is found in the STM32F407 datasheet, with the Reference Manual (RM) listing the offsets for specific registers within the memory-mapped IO for that peripheral type. In this case the MODER register is at offset 0x00, with GPIOA at address 0x40020000. The byte order is printed left to right, meaning that the first byte is on the left side.
In this case we can see that MODER1 (for pin 1) is set to ’01’, meaning general-purpose output mode.
Time to Quit Guessing
Many are the times when I found myself or others get stuck pouring over lines of code, speculating which one of those lines might be the cause of the weird symptoms. Suffice it to say that doing so is neither fun nor productive. Along with tools like Valgrind, debuggers like GDB are perfect for getting answers to questions, even questions you didn’t know you wanted to ask. It’s especially useful with something like embedded development, where the immediate feedback from newly flashed firmware might be… absent or not quite as expected.
It pays to establish a strict routine of testing for isolating test cases, and to hit the problematic firmware in-situ with a targeted testing plan, using tools like GDB. Create a checklist of which items to check first when something doesn’t work, then work your way up from there.
As non-deterministic as debugging sometimes may seem — and with Heisenbugs certainly endeavoring to make it appear that way — in the end there’s a good, solid reason for every issue. You just need to find out what bit to look at in which manner. Becoming comfortable with a powerful tool like GDB is definitely a major asset there.
As a debugger, GDB is a veritable Swiss Army knife. And just like exploring all of the non-obvious uses of a those knives, your initial response to the scope of GDB’s feature set is likely to be one of bewilderment, subsequent confusion, and occasional laughter. This is an understandable reaction in the case of the Swiss Army knife as one is unlikely to be in the midst of an army campaign or trapped in the wilderness. Similarly, it takes a tricky debugging session to really learn to appreciate GDB’s feature set.
If you have already used GDB to debug some code, it was likely wrapped in the comfort blanket of an IDE. This is of course one way to use GDB, but limits the available features to what the IDE exposes. Fortunately, the command line interface (CLI) of GDB has no such limitations. Learning the CLI GDB commands also has the advantage that one can perform that critical remote debug session even in the field via an SSH session over the 9600 baud satellite modem inside your Swiss Army knife, Cyber Edition.
Have I carried this analogy too far? Probably. But learning the full potential of GDB is well worth your time so today, let’s dive in to sharpen our digital toolsets.
Godmode for Running Code
Example GDB session.
The concept behind a debugger is fairly uncomplicated: all too often something is preventing code which you have written from working, or you want to take a closer look at certain states within the application as it is executing. A simple way to do this is by printing out the values of variables to a terminal or serial port, but the much more powerful way is to use a debugger like GDB to interactively work with the code as it executes.
This means pausing the execution, stepping forward and backward through individual lines of code, inspecting stack frames and parts of memory, modifying the contents of memory and specific variables, and so on. Along with the setting of breakpoints and the watching of variables, virtually any part of the application’s execution can be monitored and influenced. This includes when things go south and the execution terminates with some fault condition, allowing a stack trace to be recalled.
While GDB can be used with any application’s binary, it’s infinitely more useful when the debug symbols are also provided to the debugger. These debug symbols are text strings including source code, as well as other information. They are included in the binary by the compiler when instructed to do so. For GCC-based compilers and LLVM this is usually done using the -g flag.
Local Hero
Running through a local debug session is a good way to become acquainted with how to use GDB’s command line interface. Be sure to have a handy command reference within easy reach at any time when using GDB. Doing so will make it easy to become familiar with the more involved commands.
The essential ones to know are break (b), for setting a break point, info for obtaining information locals, threads, etc. Further backtrace (bt) and continue (c), next (n) and step (s) for printing out a backtrace, continuing execution and moving through the code in increments, respectively. After loading the executable with GDB, the program is started with run (r), which can be supplied with any command line arguments to the executable.
Let’s write a very simple program we can use for debugging practice:
/* hello.c - Hello World */

#include<stdio.h>

int main(void) {
        char hello[] = "Hello World";
        printf("%s\n", hello);
        return 0;
}
We’ll use the -g3 flag when compiling to include debug symbols. Now let’s walk through this C-based Hello World example:
gcc -o hello -g3 hello.c
gdb ./hello

[..]
(gdb) b main
Breakpoint 1 at 0x1169: file hello.c, line 5.
(gdb) run
Starting program: /home/hackaday/hello
Breakpoint 1, main() at hello.c:5
5 int main(void) {
(gdb) n
6 char hello[] = "Hello World";
(gdb) n
7 printf("%s\n", hello);
(gdb)
We first set a break point at the main()function, then run to start the program. After the breakpoint, with each execution of next (or just hitting enter on an empty input to repeat the previous command), we’ll proceed to the next line of the application, without stepping into function calls. That’s what step is for. If we use printf() in the code, for example, using step would cause us to examine every line of that function and its implementation as well. Whether this is desirable depends on one’s needs.
Finally, we can examine variables and memory using print (p) for printing variables and x to print bytes at a memory address. E.g.:
(gdb) print hello
$1 = "Hello World"
Most of the commands are quite straight-forward, and safe. Barring the use of GDB’s set command, using which one can not only change GDB’s settings, but also edit memory contents. Use this one with caution.
Jacking Into the Remote
Running a remote GDB session is roughly the same as a local session, with the obvious complication of having to establish the session on a remote system. Said remote system can be anything from a server, desktop or other system running a full-blown OS, down to a microcontroller (MCU) running straight on the bare metal.
The main requirement for GDB to establish a debugging session on a remote system, is for there to be a GDB server (gdbserver) instance which the GDB tool can connect to. This GDB server then acts as a bridge between GDB and the active debug session. This connection can be established via TCP or a serial line. This makes it a highly portable approach that works both for remote servers or desktop systems, as well as industrial boards with an RS-232C link.
Even more interesting is to use the GDB server approach to create a bridge to the in-circuit debugger functionality provided by microcontroller platforms such as ST’s STM32 Cortex-M-based systems. This same approach will work with few modifications for Microchip’s ARM-based SAM and AVR platforms.
OpenOCD as GDB server
Anyone who has done MCU development is likely familiar with OpenOCD. This tool is invaluable in the programming of a wide variety of MCUs, but also comes with a built-in GDB server. As an example, imagine wanting to establish a GDB session on an STM32 MCU, on a common development board like the STM32F4-Discovery one.
The first step is to start OpenOCD’s GDB server:
openocd -f board/stm32f4discovery.cfg
Next, we can connect to this server via the loopback interface, while also providing GDB (from the arm-none-eabi toolchain) with the path to the ELF binary containing the firmware:
GDB will now connect to the GDB server, with OpenOCD using the STM32F4-Discovery board’s in-circuit debugger feature of the onboard ST-Link/V2 interface. All protocol translation is now done by OpenOCD, enabling all the usual GDB features, even though the code we are debugging runs on the MCU on the development board.
As the MCU will already have booted the firmware we wish to debug, we will still have to perform one more step, which is to reset the MCU to get a GDB session we can use:
(gdb) mon reset halt
The MCU will now have been reset and in a halted state until we do something. We will now add a new temporary breakpoint and continue:
(gdb) tbreak main
(gdb) c
After continuing execution, this temporary breakpoint puts us right at the beginning of our main function, from which we can set up breakpoints and more as needed. For example, we can check out the value of a specific register of the GPIOA peripheral on this STM32F4-based board. Say we want to see whether the input and output states were set properly in the GPIO_MODER register:
(gdb) x/4tb 0x40020000
$1 = 0100 0000 0000 0000
The special syntax of the x command prints a single 32-bit address, as blocks of single bytes. The GPIOA peripheral location is found in the STM32F407 datasheet, with the Reference Manual (RM) listing the offsets for specific registers within the memory-mapped IO for that peripheral type. In this case the MODER register is at offset 0x00, with GPIOA at address 0x40020000. The byte order is printed left to right, meaning that the first byte is on the left side.
In this case we can see that MODER1 (for pin 1) is set to ’01’, meaning general-purpose output mode.
Time to Quit Guessing
Many are the times when I found myself or others get stuck pouring over lines of code, speculating which one of those lines might be the cause of the weird symptoms. Suffice it to say that doing so is neither fun nor productive. Along with tools like Valgrind, debuggers like GDB are perfect for getting answers to questions, even questions you didn’t know you wanted to ask. It’s especially useful with something like embedded development, where the immediate feedback from newly flashed firmware might be… absent or not quite as expected.
It pays to establish a strict routine of testing for isolating test cases, and to hit the problematic firmware in-situ with a targeted testing plan, using tools like GDB. Create a checklist of which items to check first when something doesn’t work, then work your way up from there.
As non-deterministic as debugging sometimes may seem — and with Heisenbugs certainly endeavoring to make it appear that way — in the end there’s a good, solid reason for every issue. You just need to find out what bit to look at in which manner. Becoming comfortable with a powerful tool like GDB is definitely a major asset there.
Hackaday editors Elliot Williams and Mike Szczys catch the best hacks you may have missed. This week we look at the new Raspberry Pi 400, use computer vision to get ready for geeky Christmas, and decypher a negative-space calendar. We get an answer to the question of what happens if you scale up a styrofoam airplane to human-size. Facebook is locking down VR headset, will hackers break them free? And take an excellent stroll down memory lane to find out what it was like to be a space-obsessed ham at the dawn of personal computers.
Take a look at the links below if you want to follow along, and as always, tell us what you think about this episode in the comments!
Today it is pretty easy to build a robot with an onboard camera and have fun manually driving through that first-person view. But builders with dreams of autonomy quickly learn there is a lot of work between camera installation and autonomously executing a “go to chair” command. Fortunately we can draw upon work such as View Parsing Network by [Bowen Pan, Jiankai Sun, et al]
When a camera image comes into a computer, it is merely a large array of numbers representing red, green, and blue color values and our robot has no idea what that image represents. Over the past years, computer vision researchers have found pretty good solutions for problems of image classification (“is there a chair?”) and segmentation (“which pixels correspond to the chair?”) While useful for building an online image search engine, this is not quite enough for robot navigation.
A robot needs to translate those pixel coordinates into real-world layout, and this is the problem View Parsing Network offers to solve. Detailed in Cross-view Semantic Segmentation for Sensing Surroundings (DOI 10.1109/LRA.2020.3004325) the system takes in multiple camera views looking all around the robot. Results of image segmentation are then synthesized into a 2D top-down segmented map of the robot’s surroundings. (“Where is the chair located?”)
The authors documented how to train a view parsing network in a virtual environment, and described the procedure to transfer a trained network to run on a physical robot. Today this process demands a significantly higher skill level than “download Arduino sketch” but we hope such modules will become more plug-and-play in the future for better and smarter robots.
General admission tickets for this weekend’s Hackaday Remoticon are only available for two more hours! These are free, but you need to have one to get in on tonight’s Bring-a-hack.
Today’s Live Events:
The Community Bring-a-Hack meetup for all general admission ticket holders begins today at 16:00 PST. Check the ticketing hub page for your link to the event which is being held on Remo.
Live streaming events open to the public will begin on Saturday at 10:00 PST with open remarks and Kipp Bradford’s keynote talk. Workshops and the SMD Challenge will live-stream all day. And Alfred Jones will present his keynote at 18:30 PST followed by the Hackaday Prize Ceremony. Follow our media channels to be notified of all live streams:
Most of the stories from this week are vulnerabilities dropped before fixes are available, many of them actively being exploited. Strap yourselves in!
Windows Kernel Crypto
The first is CVE-2020-17087, an issue in the Windows Kernel Cryptography Driver. The vulnerable system calls are accessible from unprivileged user-space, and potentially even from inside sandboxed environments. The resulting buffer overflow can result in arbitrary code executing in the kernel context, meaning this is a quick jump to root-level control over a victim system.
What exactly is the code flaw here that’s being attacked? It’s in a bit of buffer allocation logic, inside a binary-to-hex conversion routine. The function accepts an unsigned short length argument. That value is used to calculate the output buffer size, by multiplying it by six, and using an unsigned short to hold that value. See the problem? A sufficiently large value will roll over, and the output buffer size will be too small. It’s a value overflow that leads to a buffer overflow.
Because the problem is being actively exploited, the report has been made public just seven days after discovery. The flaw is still unpatched in Windows 10, as of the time of writing. It also seems to be present as far back as Windows 7, which will likely not receive a fix, being out of support. [Editor’s snarky note: Thanks, closed-source software.]
Intel Key Extraction
Microcode has been a part of CPU architecture for decades. From a certain point of view, processors have always had some sort of microcode — logic that converts instructions into discrete hardware operations. Microcode, as we think of it today, came to x86 processors with the Pentium Pro. With that processor, it was finally possible to update the microcode layer at boot, fixing bugs and problems that were found after manufacture. Intel has always distributed that microcode as an encrypted blob, keeping researchers from investigating the changes between updates. That restriction may be lifted, as a trio of researchers have managed to extract the encryption key from modern Intel CPUs.
The extraction is possible because of a vulnerability allowing access to a debug interface inside Intel chips. This technique requires physical access to the machine, and the chip resets to its factory state on a power cycle. Time will tell what other interesting tidbits will be mined from the hidden depths of Intel processors. Keep an eye on the Chip Red Pill repository for their ongoing work.
The second attack is CVE-2020-14871, a PAM vulnerability in Oracle’s Solaris. This was a true zero-day, being exploited for months before it was fixed in the same set of security updates. FireEye was the company that originally found the attack, and have been kind enough to explain it. The Pluggable Authentication Module (PAM) has a maximum response size, and uses that size to construct a buffer to hold incoming requests. The Solaris code fails to do any checks on the request, and just naively copies the string into the buffer, right past the end, if the input string is too long.
Now where do you think we could manipulate the input message for a PAM request? How about the Secure SHell Daemon? Yep, make an SSH request in keyboard-interactive mode, and use a username longer than 512 characters. In a simple test, PAM just crashes, but it’s possible to manipulate the username to compromise the machine instead.
This is a worst-case scenario. The default configuration of Solaris’ SSHD daemon was vulnerable to a simple compromise. All it takes is SSH exposed to the internet, and your machine probably got compromised. It does appear that using an SSH key, and disabling all the other SSH login methods would mitigate this vulnerability, particularly if you go so far as disabling SSH PAM altogether. This vulnerability is also present in OpenIndiana as well. 2020.10 should contain the fixes, but I can’t find any information about the previous release, 2020.04 being patched. Caveat Emptor.
Beware The BMC
I’ve always looked upon Baseboard Management Controllers (BMCs) with great skepticism. Yes, it’s incredibly useful to have a way to access a remote computer’s BIOS interface. A BMC can even be used to do a remote reinstall of the entire OS. For a machine locked away in a remote datacenter, a BMC can be a life-saver.
That BMC is also a second OS running on your hardware, that you don’t control. I’ve never been comfortable connecting that black-box OS to the internet. I have a pair of servers, and I used a secondary Ethernet port on each server to cross-connect from each server into the other’s BMC port. I can SSH in and access the interface, while keeping the BMCs completely isolated. It turns out, my paranoia is entirely justified. This article is specific to an NVIDIA SCADA system, but at least some of these vulnerabilities are present in other iterations of this BMC system. The worst offender is CVE‑2020‑11483, hardcoded credentials. This sort of bug is usually a debugging account that someone forgot to disable before shipping the firmware, it still represents a major backdoor into any system running this BMC. The old adage is still relevant: Don’t connect it to the internet!
Google’s Project Zero Details GitHub Vulnerability
Project Zero has published the details of a flaw in GitHub’s Actions system. You’ve probably interacted with Actions — when a project automatically runs a test suite on pull requests, or copies new bug reports to other repositories, it’s Actions under the hood. The vulnerability is command injection. The Project Zero bug report points out the set-env command as the most troubling, and since their PoC includes arguments being sent to the underlying Node server, I’m inclined to agree.
The political angle here is interesting too. GitHub asked for a disclosure extension at the 11th hour, 103 days after receiving the report. In their defense on October 1st, GitHub did publish an advisory disclosing essentially everything but PoC code. This just happens to be one of those security problems that happens to also be a feature for some users. If you manage a GitHub project that uses Actions, it’s probably worth taking some time to make sure you aren’t vulnerable to command injection.
Slipstreaming Through NAT
NAT, love it or hate it, has been part of our networks for years now. Regardless of whether it’s really a firewall or not, I agree with Robert Graham’s opinion:
Of all the security features out there, the #1 thing that stops the most cyberattacks/hackers every day is … NAT.
— Robᵉʳᵗ Graham, provocateur (@ErrataRob) May 14, 2019
To shake things up a bit, enter Slipstream, a very clever attack against NAT routers that support connection tracking. You may have seen this in iptables, in the RELATED keyword. SIP is a notable example of why connection tracking is useful. You pick up the phone on your desk, and dial a number. That phone opens a SIP control connection, and issues INVITEs to set up the conversation with your SIP provider. The INVITE information includes the details on the actual audio connection. Usually this is shuffled off to a high level UDP port. A headache-inducing problem for SIP providers is that NAT will block those audio connections. The solution is to include a conntrack module in the firewall that can read those INVITE messages and correctly forward the audio traffic.
This is the mechanism that Slipstream abuses. Your browser cannot generate a SIP INVITE packet, but it can send HTTP GET messages to 5060, the normal SIP port. Is there a way an attacker could generate HTTP traffic that would confuse the CONNTRACK module? The answer is yes, but it’s difficult.
To effectively fool the NAT router, Slipstream gathers data on the given network, and generates large packets that will fragment in transit. By padding the front of those packets, and aligning the fragmentation point at the start of the spoofed SIP data, a malicious site can indeed fool many NAT routers on the market today. The result is that by connecting to a malicious server, and running the JavaScript hosted there, the machine running the browser is exposed to the attacking server, as if it was no longer behind the NAT router at all. All-in-all it’s a very clever technique, but time will tell whether it ever gets used for attacks in the wild. For now, it’s just a reminder that defense-in-depth is the way to go.
[Sebastian and Karl-Johan] are two award-winning Danish Space Architects who are subjecting themselves to harsh, seemingly uninhabitable conditions, for science. The pair set out to build a lunar base that could land with the manned Moon missions in 2024. Like any good engineering problem, what good is a solution without testing? So the pair have placed their habitat in a Moon Analogue habitat and are staying in their habitat for two months. They want to really feel the remoteness, the bitter cold, and the fatigue of actually being on the moon. So far they are about halfway through their journey and expect to return home in December 2020.
When asking themselves where on Earth is it most like the Moon, they came up with Moriusaq, Greenland. It’s cold, remote, in constant sunlight this time of year, and it is a vast white monochrome landscape just like the moon. The first moon settlement missions are expected to be at the South Pole of the Moon, as known as the Peak of Eternal Light. The habitat itself is a testament to the duo’s ingenuity. The whole structure folds to fit the tight space and weight requirements of rockets. Taking 2.9m3 (102 ft3) when stored, it expands 560% in volume to 17.2m3 (607 ft3). In Greenland, the structure needs to withstand -30ºC (-22ºF) and 90 km/h winds.
Because the South Pole is in constant sunlight, the temperature varies much less there than on the rest of the Moon, which makes Greenland a very good analogue temperature-wise. The foldable skin is covered in solar panels, both on the top of the bottom. The highly reflective nature of the Moon’s surface makes it easy to capture the light bouncing up onto the bottom of the habitat.
Several other bits of technology have been included onboard, like a 3D printer, a circadian light stimulation system, an algae reactor, and a weather simulation. Since both the Moon and Greenland are in constant sunlight, the pod helps regulate the circadian rhythms of the occupants by changing the hue and brightness throughout the day. The weather simulation tries to break up the monotony of space by introducing weather like a stormy day or rainbow colours.
Their expedition is still ongoing and they post daily mission updates. While some might call their foray into the unknown madness, we call it bold. Currently, NASA is planning its Artemis mission in 2024 and we hope that the lessons learning from the Lunark and other experiments culminate in a better experience for all astronauts.
[Sebastian and Karl-Johan] are two award-winning Danish Space Architects who are subjecting themselves to harsh, seemingly uninhabitable conditions, for science. The pair set out to build a lunar base that could land with the manned Moon missions in 2024. Like any good engineering problem, what good is a solution without testing? So the pair have placed their habitat in a Moon Analogue habitat and are staying in their habitat for two months. They want to really feel the remoteness, the bitter cold, and the fatigue of actually being on the moon. So far they are about halfway through their journey and expect to return home in December 2020.
When asking themselves where on Earth is it most like the Moon, they came up with Moriusaq, Greenland. It’s cold, remote, in constant sunlight this time of year, and it is a vast white monochrome landscape just like the moon. The first moon settlement missions are expected to be at the South Pole of the Moon, as known as the Peak of Eternal Light. The habitat itself is a testament to the duo’s ingenuity. The whole structure folds to fit the tight space and weight requirements of rockets. Taking 2.9m3 (102 ft3) when stored, it expands 560% in volume to 17.2m3 (607 ft3). In Greenland, the structure needs to withstand -30ºC (-22ºF) and 90 km/h winds.
Because the South Pole is in constant sunlight, the temperature varies much less there than on the rest of the Moon, which makes Greenland a very good analogue temperature-wise. The foldable skin is covered in solar panels, both on the top of the bottom. The highly reflective nature of the Moon’s surface makes it easy to capture the light bouncing up onto the bottom of the habitat.
Several other bits of technology have been included onboard, like a 3D printer, a circadian light stimulation system, an algae reactor, and a weather simulation. Since both the Moon and Greenland are in constant sunlight, the pod helps regulate the circadian rhythms of the occupants by changing the hue and brightness throughout the day. The weather simulation tries to break up the monotony of space by introducing weather like a stormy day or rainbow colours.
Their expedition is still ongoing and they post daily mission updates. While some might call their foray into the unknown madness, we call it bold. Currently, NASA is planning its Artemis mission in 2024 and we hope that the lessons learning from the Lunark and other experiments culminate in a better experience for all astronauts.
[Sebastian and Karl-Johan] are two award-winning Danish Space Architects who are subjecting themselves to harsh, seemingly uninhabitable conditions, for science. The pair set out to build a lunar base that could land with the manned Moon missions in 2024. Like any good engineering problem, what good is a solution without testing? So the pair have placed their habitat in a Moon Analogue habitat and are staying in their habitat for two months. They want to really feel the remoteness, the bitter cold, and the fatigue of actually being on the moon. So far they are about halfway through their journey and expect to return home in December 2020.
When asking themselves where on Earth is it most like the Moon, they came up with Moriusaq, Greenland. It’s cold, remote, in constant sunlight this time of year, and it is a vast white monochrome landscape just like the moon. The first moon settlement missions are expected to be at the South Pole of the Moon, as known as the Peak of Eternal Light. The habitat itself is a testament to the duo’s ingenuity. The whole structure folds to fit the tight space and weight requirements of rockets. Taking 2.9m3 (102 ft3) when stored, it expands 560% in volume to 17.2m3 (607 ft3). In Greenland, the structure needs to withstand -30ºC (-22ºF) and 90 km/h winds.
Because the South Pole is in constant sunlight, the temperature varies much less there than on the rest of the Moon, which makes Greenland a very good analogue temperature-wise. The foldable skin is covered in solar panels, both on the top of the bottom. The highly reflective nature of the Moon’s surface makes it easy to capture the light bouncing up onto the bottom of the habitat.
Several other bits of technology have been included onboard, like a 3D printer, a circadian light stimulation system, an algae reactor, and a weather simulation. Since both the Moon and Greenland are in constant sunlight, the pod helps regulate the circadian rhythms of the occupants by changing the hue and brightness throughout the day. The weather simulation tries to break up the monotony of space by introducing weather like a stormy day or rainbow colours.
Their expedition is still ongoing and they post daily mission updates. While some might call their foray into the unknown madness, we call it bold. Currently, NASA is planning its Artemis mission in 2024 and we hope that the lessons learning from the Lunark and other experiments culminate in a better experience for all astronauts.
We’ve seen the Jetsons, Star Wars, and Silent Running. In the future, all the menial jobs will be done by robots. But Walmart is reversing plans to have six-foot-tall robots scan store shelves to check stock levels. The robots, from a company called Bossa Nova Robotics, apparently worked well enough and Walmart had promoted the idea in many investor-related events, promising that robot workers would reduce labor costs while better stock levels would increase sales. So why did the retail giant say no to these ‘droids? Apparently, they found better ways to check stock and, according to a quote in the Wall Street Journal’s article about the decision, shoppers reacted negatively to sharing the aisle with the roving machines.
The robots didn’t just check stock. They could also check prices and find misplaced items. You can see a promotional video about the device below.
We have to wonder what this means for robots in general. People like us — Hackaday readers — tend to embrace new technology and we are more likely to follow a robot like this around trying to understand its operation. But we aren’t the majority. Are people afraid for their jobs? Being injured by a runaway machine? A robot uprising?
On the other hand, Walmart continues to use other robots. Notably, I’ve noticed QR-like barcodes that the floor mopper machines use to locate themselves. They also use less mobile robots like cash counters. However, the floor moppers aren’t rolling around during prime shopping hours.
We figure Bossa Nova still has a play. There are plenty of warehouses and maybe even warehouse stores where a machine rolling down an aisle wouldn’t warrant a second look. But if Walmart is afraid to expose customers to the device, we doubt many other retailers will for awhile. Unless there’s something about the demographic. Would people shopping in Home Depot be less worried about a machine? We don’t know.
We also have to wonder what this means for other working robots. We’ve seen robots preparing fast food and driving your car, for example. People are spending a lot of time thinking about how robots will work with coworkers. Maybe they need to also factor in how customers will react to being served by robots or even just sharing space with them.
What do you think? Will it bother you to see a robot taxi drive pass you on the freeway while you eat your robotically-prepared hamburger? Or do you think those who oppose are just modern-day Luddites?
One of the problems with using a Raspberry Pi or most other systems in a production environment is dealing with sudden shutdowns due to power loss. Modern operating systems often keep data in memory that should be on disk, and a sudden power cycle can create problems. One answer is an uninterruptible power supply, but maintaining batteries is no fun. [Scott] wanted to do better, so he built a UPS using supercapacitors.
A supercapacitor UPS is nearly ideal. The caps charge quickly and don’t wear out as a battery does. The capacitors also don’t care if they stay in storage for a long time. The only real downside is they don’t have the capacity that batteries can have, but for a small computer like a Pi Zero it is pretty easy to gang up enough capacitors to do the job.
In particular, [Scott’s] design uses five 10F capacitors, each charged to 2.5V. The downside is that this requires a 12V supply, so he did a second design that uses only two capacitors each taking half of a 5V supply.
There are several options for converting the capacitor voltage to the desired output voltage. There’s also software to run the onboard microcontroller and force a shutdown in the Pi if the main power drops.
Naturally, this isn’t an original idea, but it is well done. You can also buy cheap ready-made UPS boards in the Pi form factor, but you might want to check out some aftermarket software for them if you use one.
Radiative cooling paint is not a completely new animal, but the formulation developed at Purdue is quite impressive compared to commercially-available paints that only reflect 80-90% of sunlight.
Purdue’s paint reflects 95.5% of sunlight. It can keep surfaces up to 18°F cooler than their surroundings, even in direct sunlight. Where does the heat go? The paint radiates infrared heat, so it escapes the atmosphere and goes into deep space.
How does it do this? With abundantly available calcium carbonate fillers — the chalky stuff that antacids are made of. The paint absorbs next to no UV rays because of the wide band gaps in the atomic structure of calcium carbonate. Take a brief tour of this amazing paint after the break.
We wonder how many rooftops and roadways we’d have to paint with this stuff to have a chance at reversing climate change. It’s not terribly expensive to make, so the problem shifts to widespread education and adoption. What do you think?
Radiative cooling paint is not a completely new animal, but the formulation developed at Purdue is quite impressive compared to commercially-available paints that only reflect 80-90% of sunlight.
Purdue’s paint reflects 95.5% of sunlight. It can keep surfaces up to 18°F cooler than their surroundings, even in direct sunlight. Where does the heat go? The paint radiates infrared heat, so it escapes the atmosphere and goes into deep space.
How does it do this? With abundantly available calcium carbonate fillers — the chalky stuff that antacids are made of. The paint absorbs next to no UV rays because of the wide band gaps in the atomic structure of calcium carbonate. Take a brief tour of this amazing paint after the break.
We wonder how many rooftops and roadways we’d have to paint with this stuff to have a chance at reversing climate change. It’s not terribly expensive to make, so the problem shifts to widespread education and adoption. What do you think?
A mechanical and manufacturing engineer by day, [Tyler Collins] taught himself electronics and firmware development in his spare time and created an open source Lego controller called Evlōno One. It is based on the STM32 and Arduino ecosystems, and compatible with a impressive variety of existing Lego controllers, sensors and actuators. [Tyler] encountered Lego Mindstorms while helping in an after-school program, and got to wondering whether he could make a more flexible controller. We’d have to say he succeeded, and it’s amazing how much he has packed into this 4 x 4 single-height brick format.
The Evlōno One is based on an ESP32 dual-core MCU, and has WiFi, Bluetooth, and an IR transmitter for wireless connectivity. It also boasts USB-C power delivery, three motor controllers, speakers, LEDs and a button. Dig through the Kickstarted page for more details on these interfaces and specifications. Both the firmware and the hardware will be published as open source on GitHub.
Although [Tyler] has the prototypes all running, he notes this is his first big production effort. FCC certification testing and production mold tooling are the two biggest items driving the scheduled Feb 2021 shipments. If computer driven Lego modeling is one of your hobbies, definitely check out [Tyler]’s project. And if you missed our [Daniel Pikora]’s FOSSCON 2018 presentation about the intersection (collision) of Legos and Open Source, our article must-read for you folks in the Adult Fan of Lego (AFOL) community.

 Inside the printed puck is an Arduino Nano running an MPU6050 accelerometer, a 12-NeoPixel ring, and a piezo buzzer. [DIY_Maxell] reused a power bank charging circuit to charge up the small LiPo battery.
 , provocateur (@ErrataRob)
  The habitat itself is a testament to the duo’s ingenuity. The whole structure folds to fit the tight space and weight requirements of rockets. Taking 2.9m3 (102 ft3) when stored, it expands 560% in volume to 17.2m3 (607 ft3). In Greenland, the structure needs to withstand -30ºC (-22ºF) and 90 km/h winds.